Introduction: The Car Sales Report Automation
A Power Automate flow is used to get the monthly sales at a car dealership by make and model. The Power BI dataset containing car sales transactions is summarized by count and total sales.
The result of the Run A Query Against A Dataset action is transformed into an array of values to be included in an Excel report.
Create A New Visual In Power BI
The easiest way to construct the query used in the Power BI – Run A Query Against A Dataset action is to create a Power BI table visual with the desired data. Then we can copy the query from the visual without writing an code.
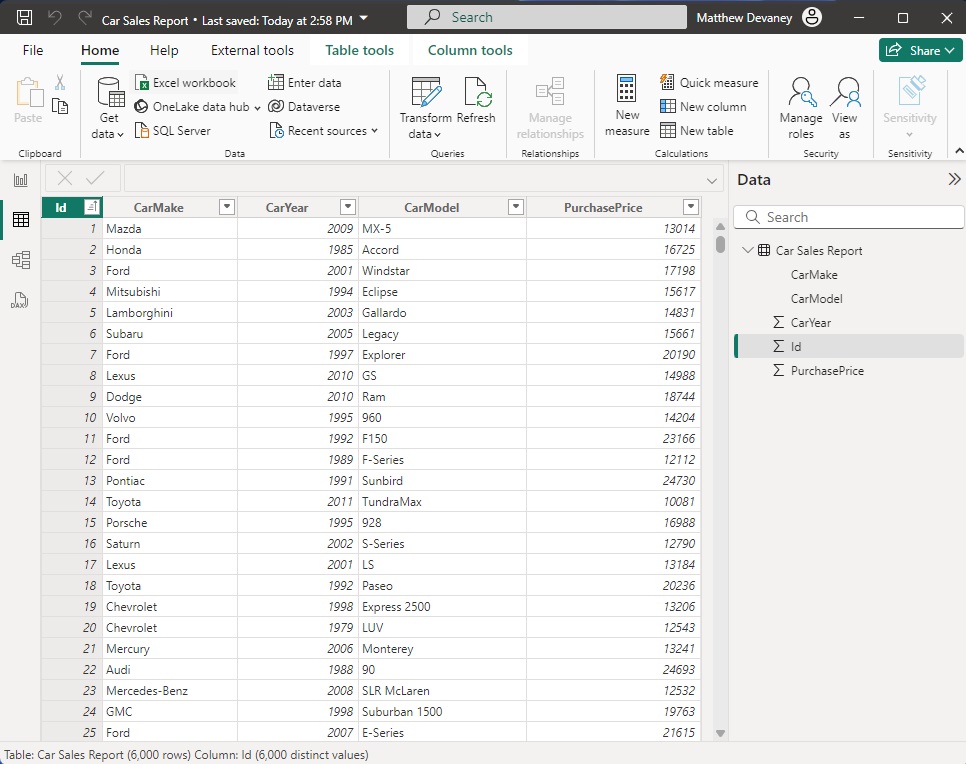
Open Power BI desktop and load the dataset. In this example, we will use a dataset named Car Sales Report with the following columns:
- Id – whole number, unique identifier
- CarMake – text
- CarYear – whole number
- CarModel – text
- PurchasePrice – decimal
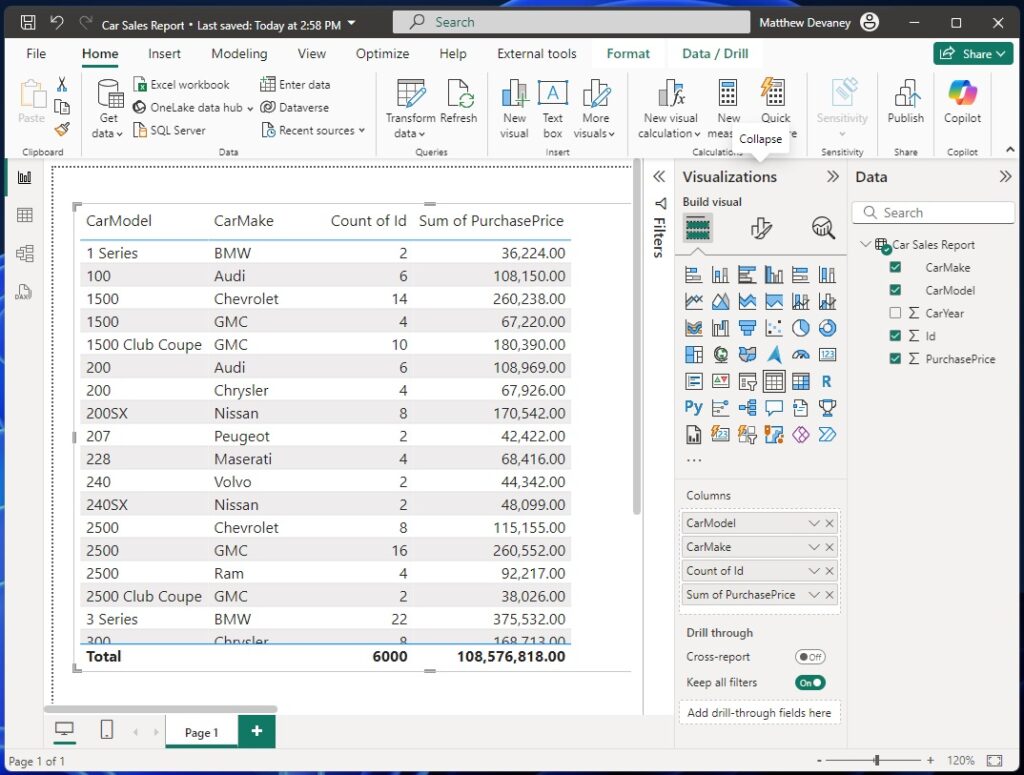
Then add a Power BI table visual to the report and include the following columns:
- CarModel
- CarMake
- Count of Id
- Sum of Purchase Price
Make to sure to publish the Power BI report to a workspace once this is done.
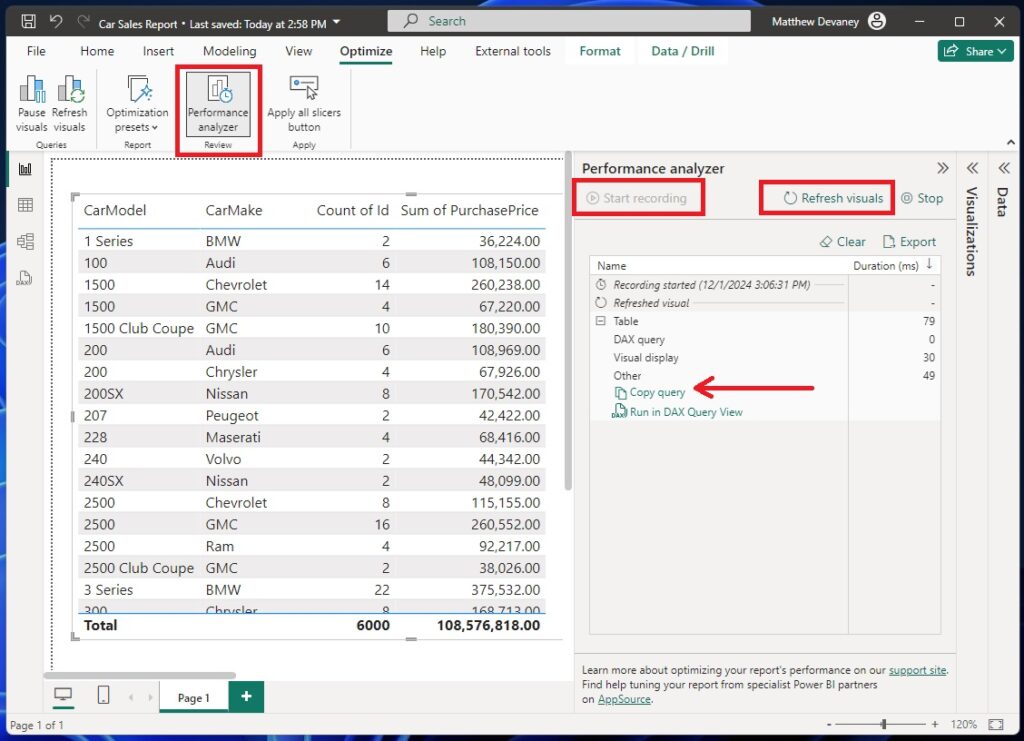
Copy The Power BI Visual DAX Query From Performance Analyzer
All Power BI visuals are defined by a DAX query although no code was written to create them. We can use the DAX query which defines the Power BI table visual to get data in Power Automate.
Go to the Optimize tab in Power BI desktop and select Performance Analyzer. Expand the Performance Analyzer menu and start recording. Refresh the visuals and then copy the query to the clipboard.
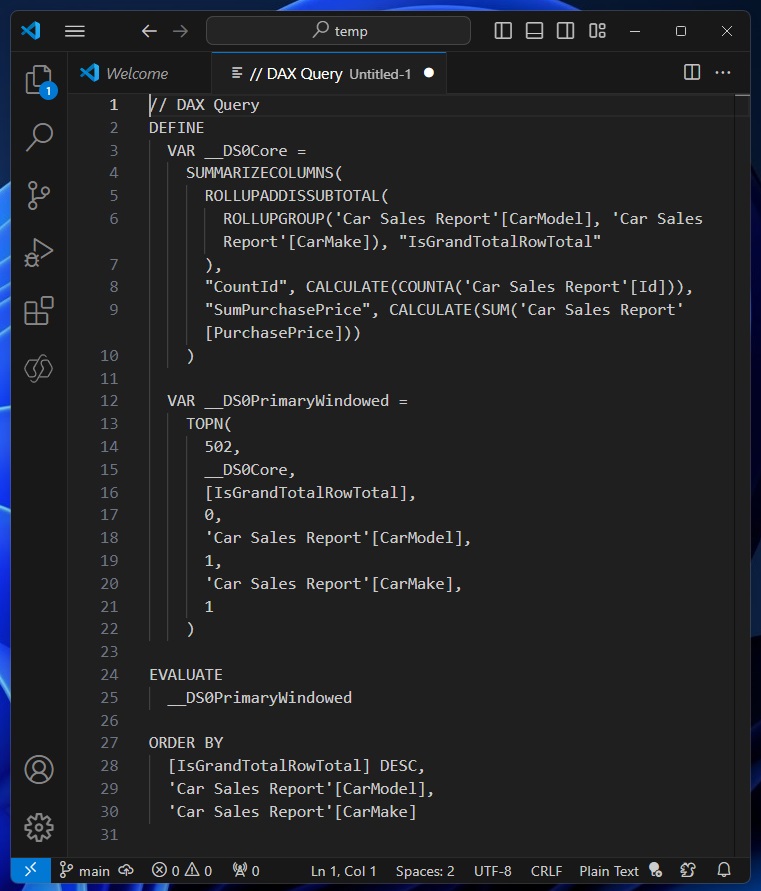
The DAX query copied to the clipboard looks like this:
Run A Query Against A Power BI Dataset
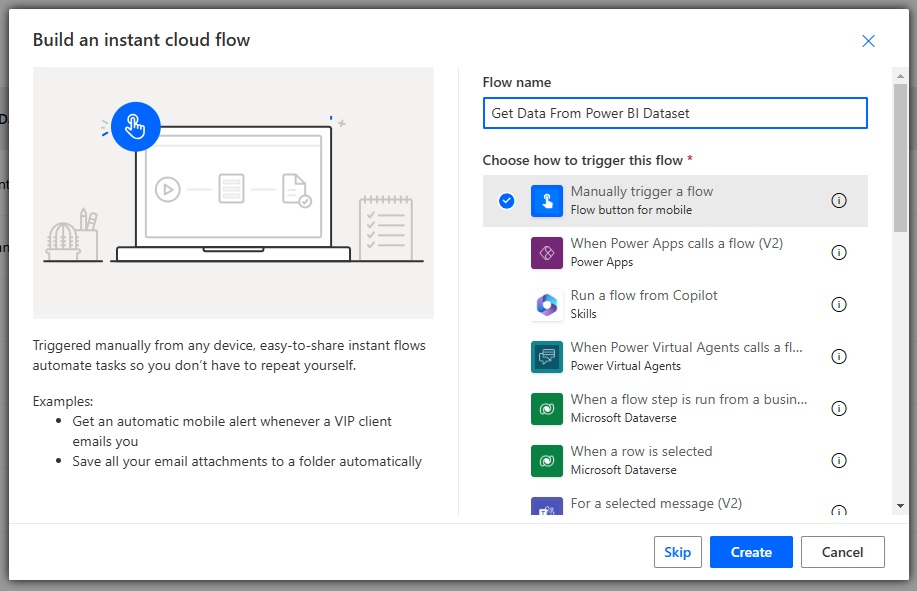
Now that we have written the Power BI query we can build a flow to run it against the Power BI dataset. Open Power Automate and create a new instant flow named Get Data From Power BI Dataset.
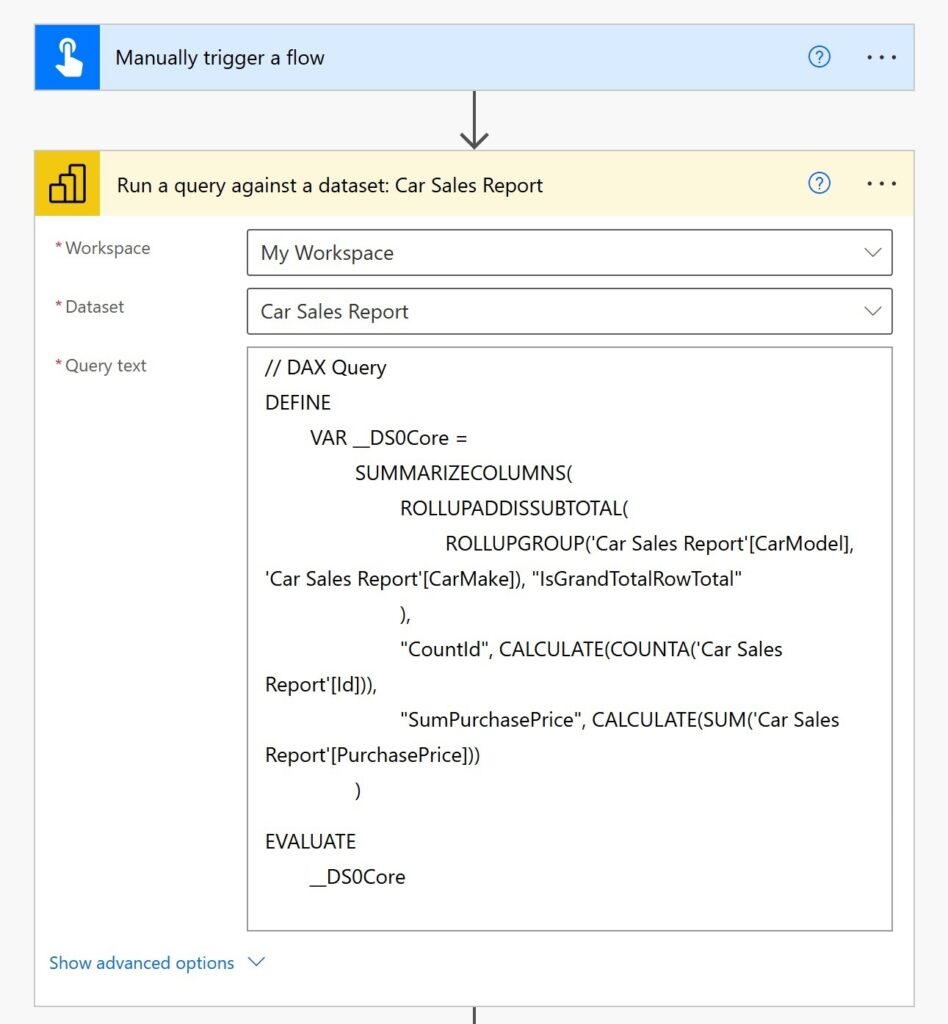
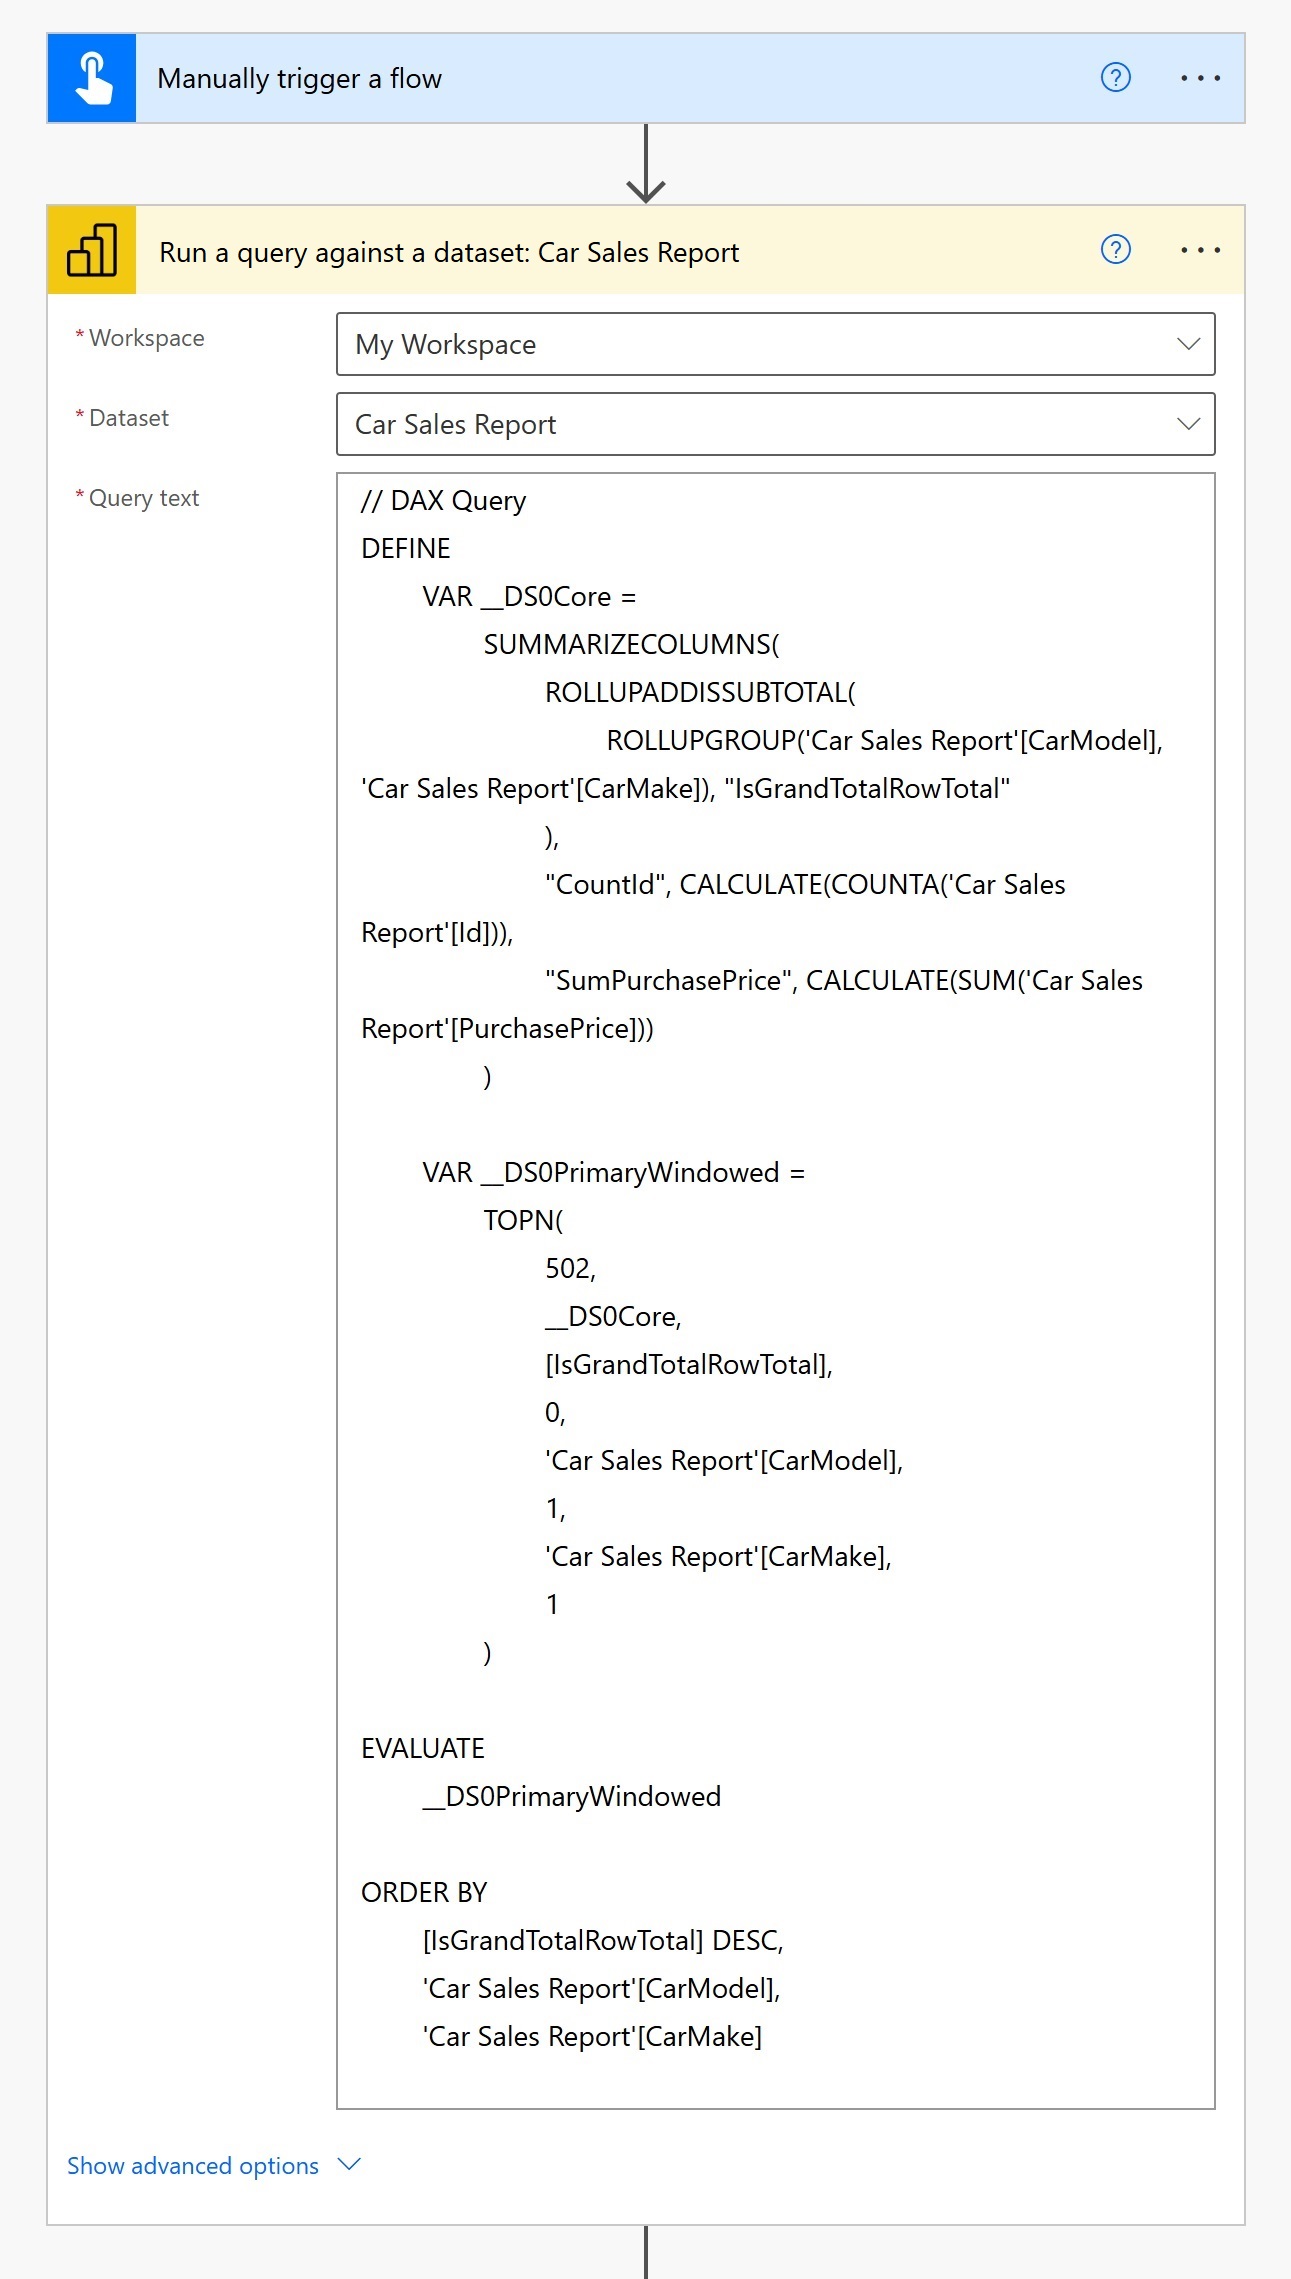
Add a Power BI – Run A Query Against A Dataset action to the flow. Select the workspace and dataset then paste the DAX Query from Power BI Desktop.
Remove The TopN Results Function
The TopN result function included in the Power BI query limits the total amount of records returned to 502 records by default. We can remove the TopN function to return all matching records in the dataset.
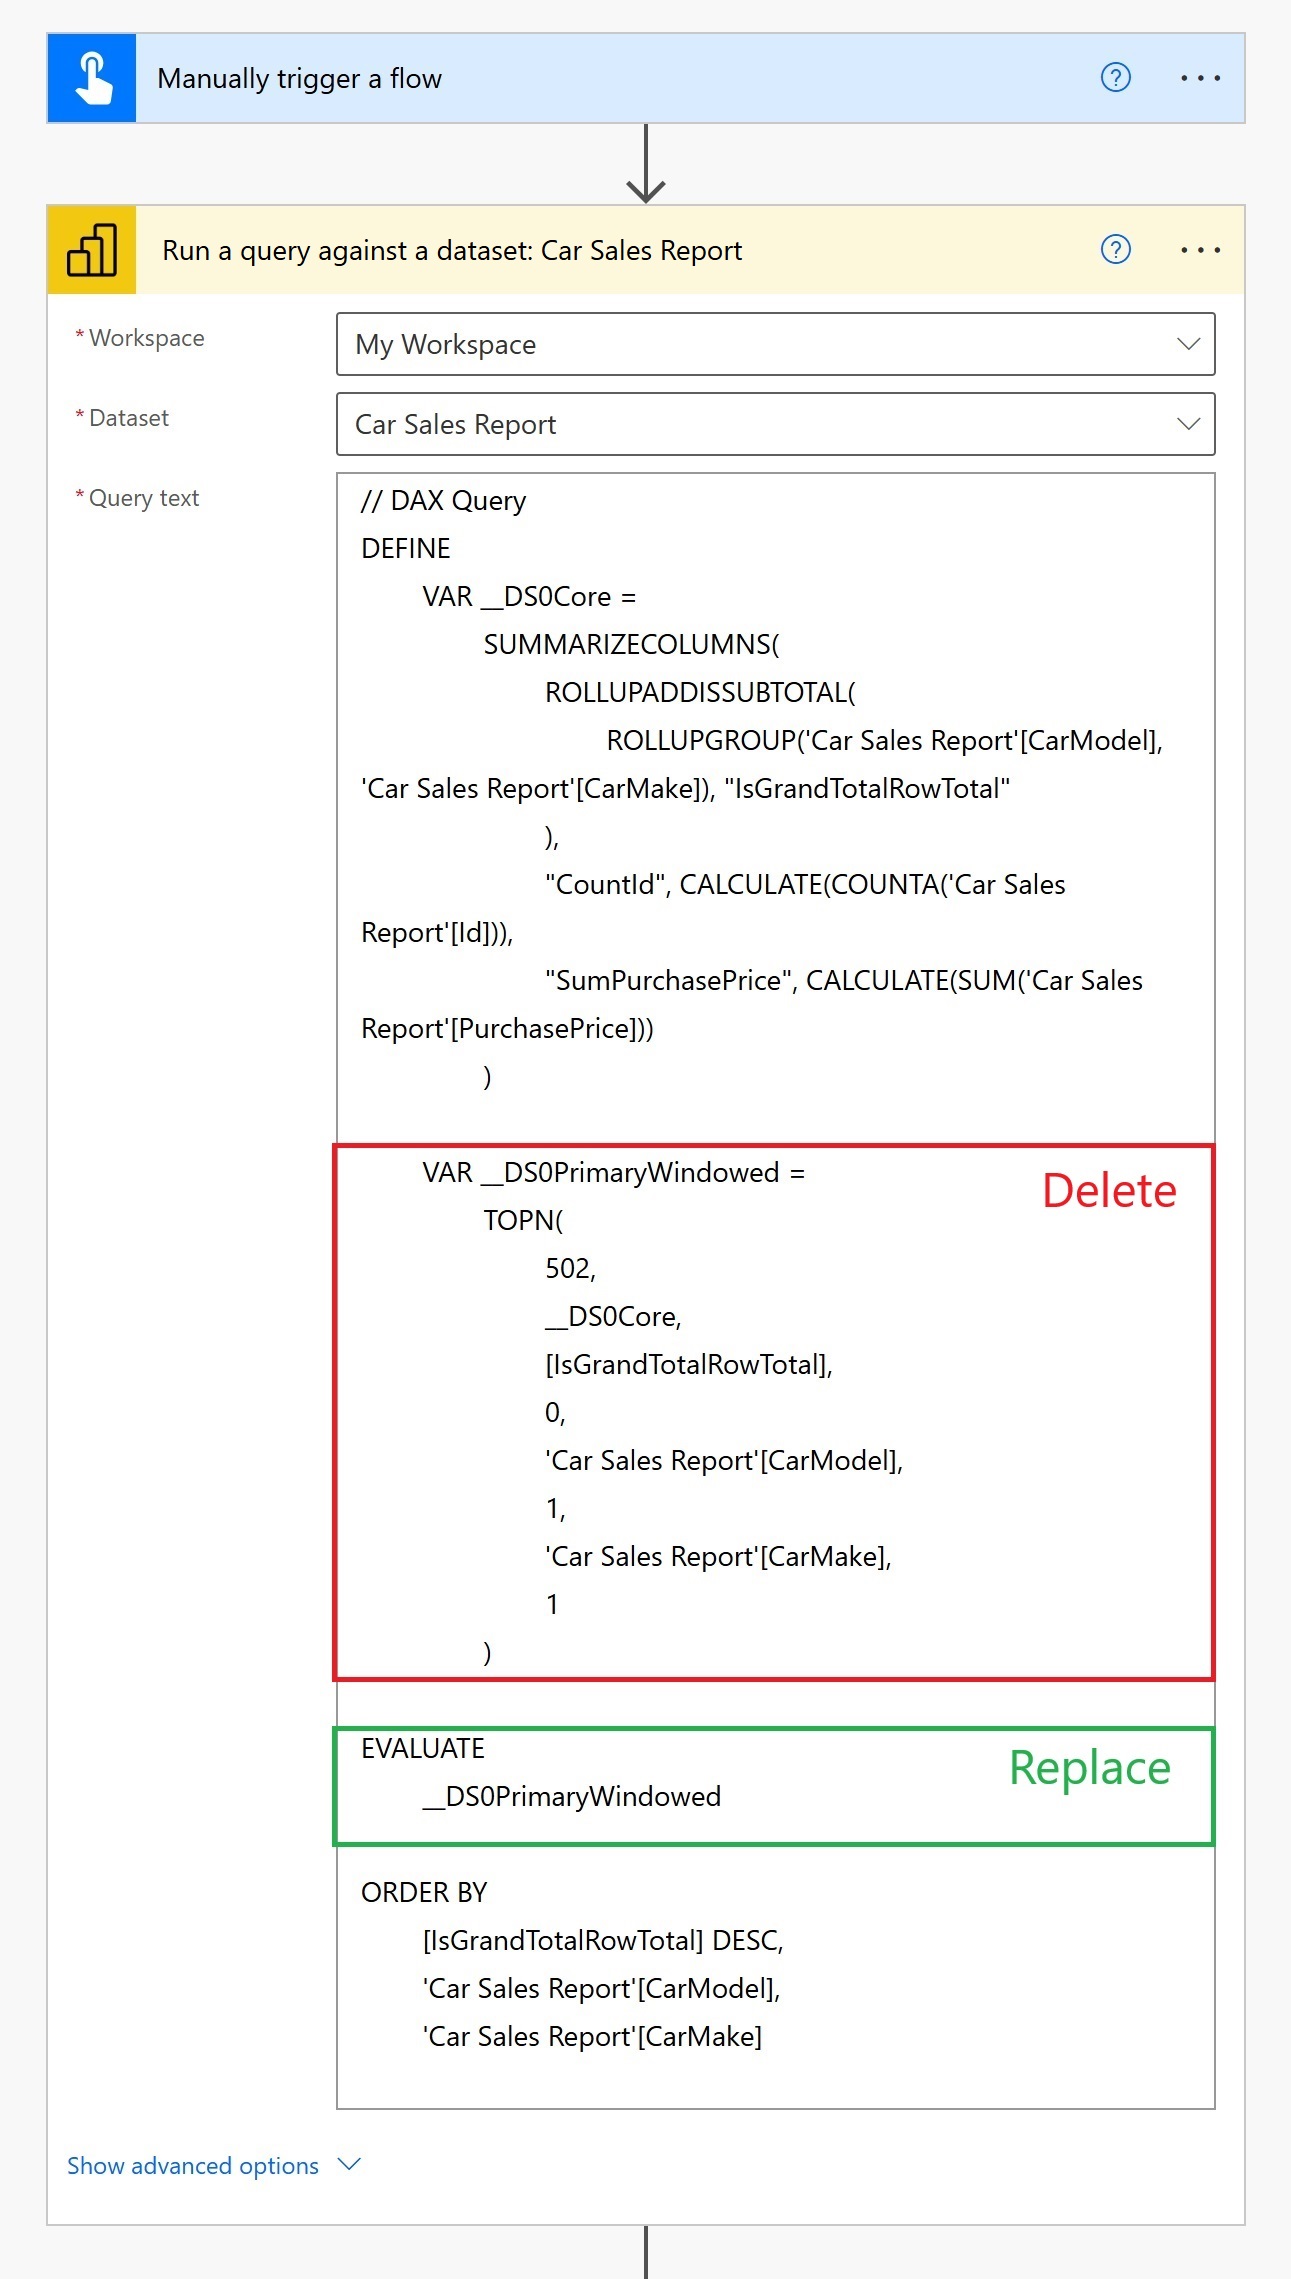
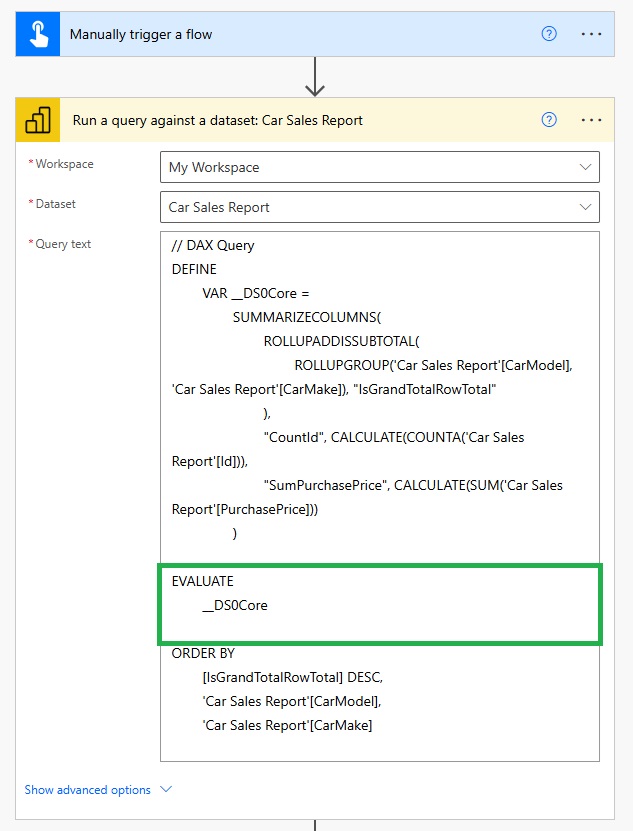
Additionally, the EVALUATE clause must by updated to match the variable name included in the DEFINE clause.
Review The Power BI Query Results In Power Automate
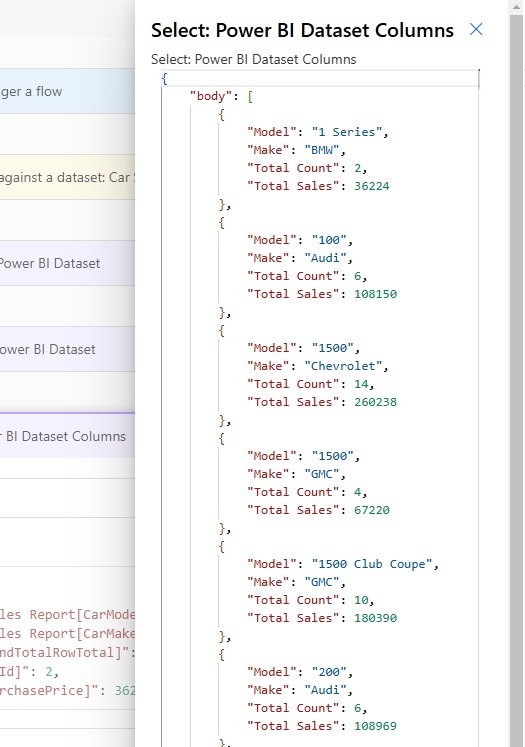
At this point we should run the Power Automate flow to ensure the correct results are returned from the Power BI dataset. The query results are returned as an array in the property named First table rows.
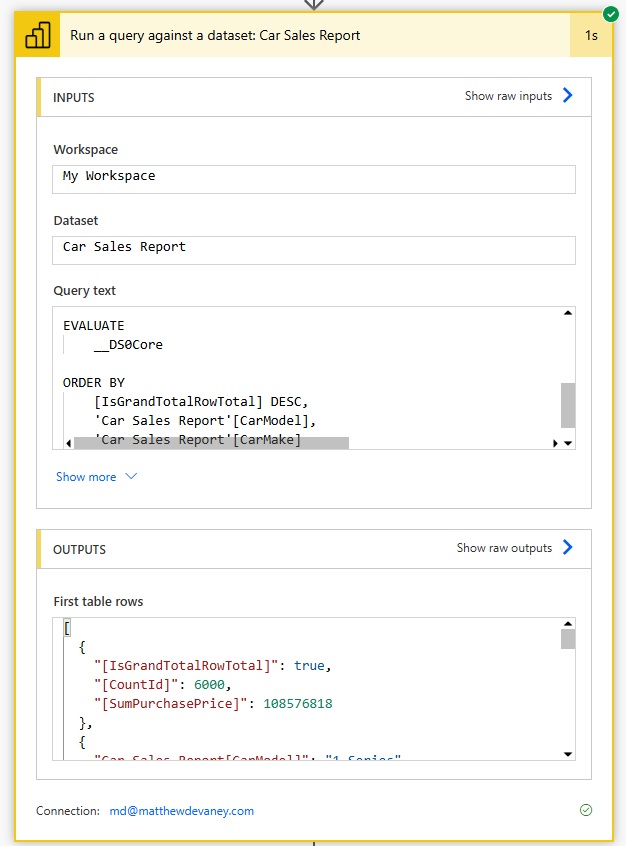
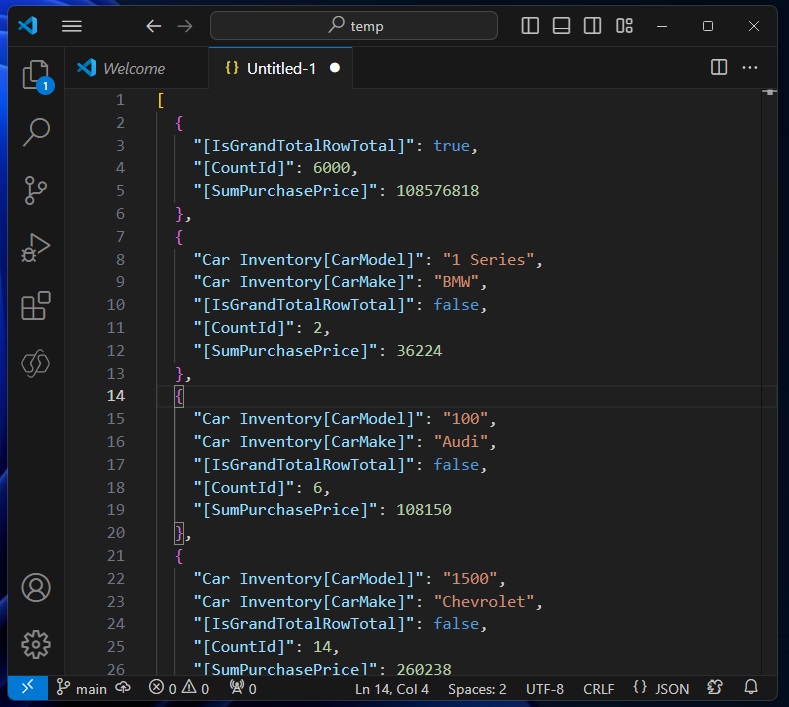
The first record in the array contains the Grand Totals for Count of Id and Sum of Purchase Price. The remaining rows include the count and sum for each car make and model.
Format The Power BI Dataset For Reporting
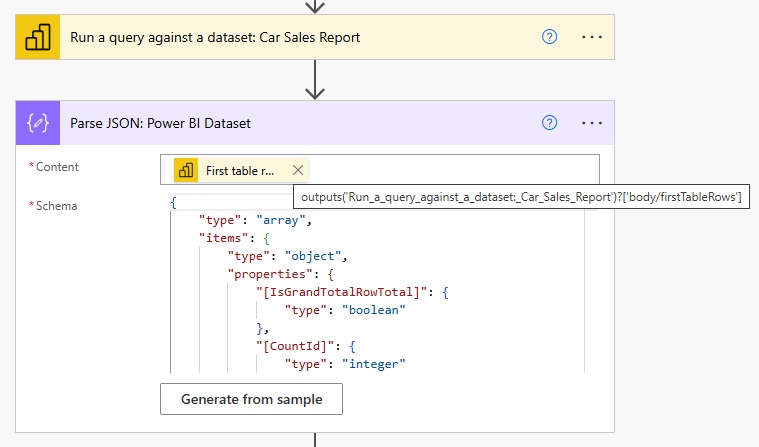
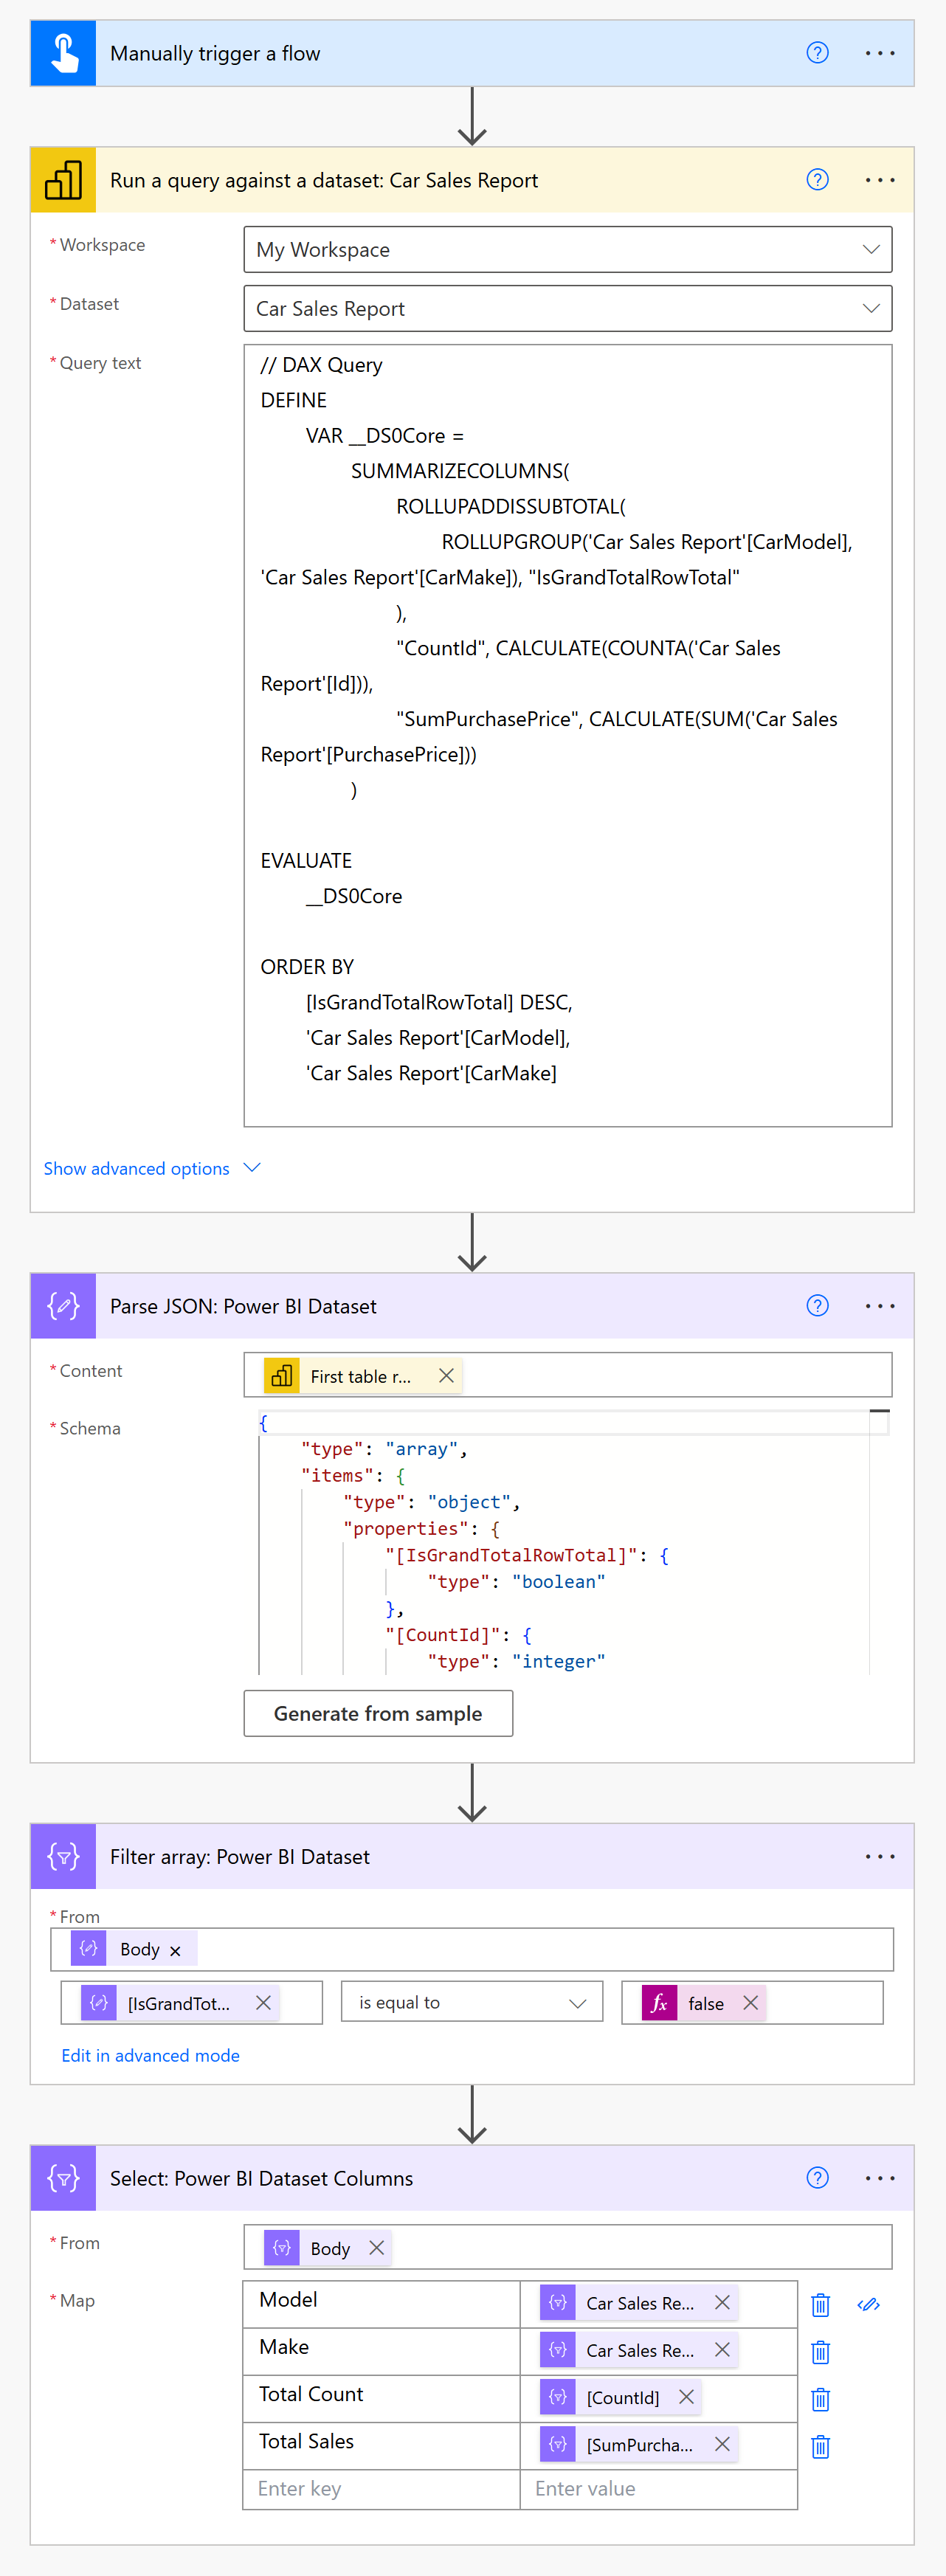
To use the Power BI dataset for reporting we want to remove the grand totals and update the column titles to friendly display names. Start by inserting a ParseJSON action after the Power BI action to get the dynamic values for the dataset. Include the First table rows in the content field.
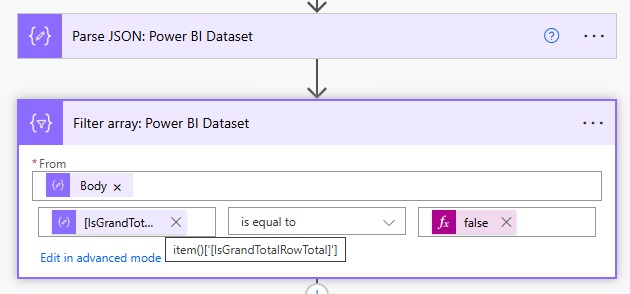
Add a Filter array action to remove the grand totals from the array. Use values from the Body of the Parse JSON action and get values where [IsGrandTotal] equals false.
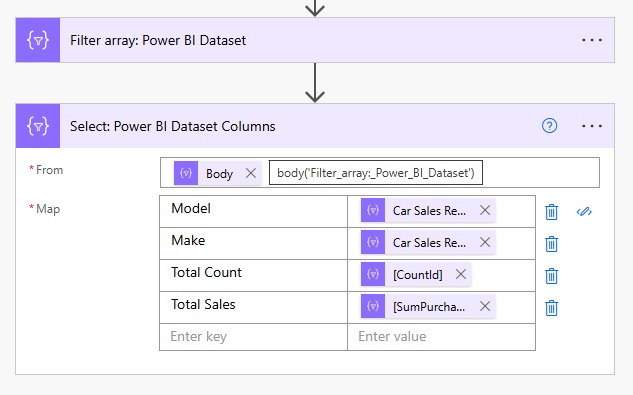
Insert a Select action to rename the Power BI dataset column names. Use the Body from the Filter array action and setup the mapping as shown below.
Run The Power Automate Flow To Get A Power BI Dataset
The flow to retrieve a Power BI dataset is completed. Run the flow to check the results.
The array of values from the Power BI dataset is returned like this:
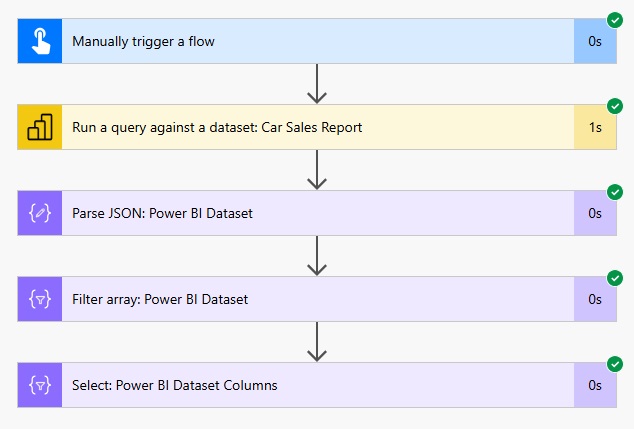
Completed Flow To Run A Query Against A Power BI Dataset
Here is the full Power Automate flow showing how to return the rows from a Power BI dataset.
Comments